Start the application by a click on the application icon.
crystal-facet-uml shows a window with
toolbar on top,
drawing area in the center,
element configuration widgets to the right and
an optional notification bar at the bottom.
 |
The top row of a window provides buttons to select files, change the view and modify model elements.
 |
![]()
Creates a new database file.
Enter a filename; a json-based file structure is used to store your data in a git-friendly format.
![]()
Opens an existing database file.
To open json-based formats (e.g. .cfuJ), write access to the parent folder is required.
If you find a .tmp-cfu file, this indicates that the last session was possibly terminated abnormally. You should open this file to continue from the latest state. Alternatively, select the .cfuJ to continue from the last save action. Do not open *-journal files.
![]()
![]()
![]()
Stores the latest changes to the database immediately. Note that at regular program exit, the database is stored automatically anyhow.
The icon indicates if there are unsaved changes, it is yellow in case the window is in the background.
![]()
Exports all diagrams to the selected folder. Supported export formats are docbook, html, json, pdf, png, ps, svg, txt, xmi.
![]()
Opens another window on the same database. This new window allows you to work reliably with multiple windows on the same database.
![]()
Cut all selected (pink-cornered) elements to the clipboard (features of classifiers are copied if the classifier is selected)
![]()
Copy all selected (pink-cornered) elements to the clipboard (features of classifiers are copied if the classifier is selected)
![]()
If the clipboard does not contain diagrams, classifiers and relationships from the clipboard are copied into the current diagram.
If the clipboard contains a diagram, this diagram is pasted below the current diagram. All other elements are pasted into the new diagram.
If a classifier is identical to an existing one (same uuid), an instance of the existing classifier is pasted to the diagram. Otherwise a new classifier is created.
![]()
Deletes all selected (pink-cornered) elements.
This operation may fail on a diagram if the selected diagram contains non-selected elements or child diagrams.
![]()
Toggles the selected (pink-cornered) classifiers between classes, named instances and anonymous instances.
No effect on relationships and features.
![]()
Toggles the selected (pink-cornered) classifiers between yellow-marked, greyed-out and normal. (Does not work for relationships and features)
The center area of a window allows to view and change diagrams and model elements.
 |
Diagrams are layouted automatically. You can influence the locations of classifiers only.
When adding too many classifiers or relationships, auto layouting may not achieve the expected results. In many cases, splitting the diagram into two or more diagrams solves the layouting issues and at the same time improves understandability by focusing on one aspect/topic per diagram. For examples, see the section called “Use Abstractions and Hierarchies”.
![]()
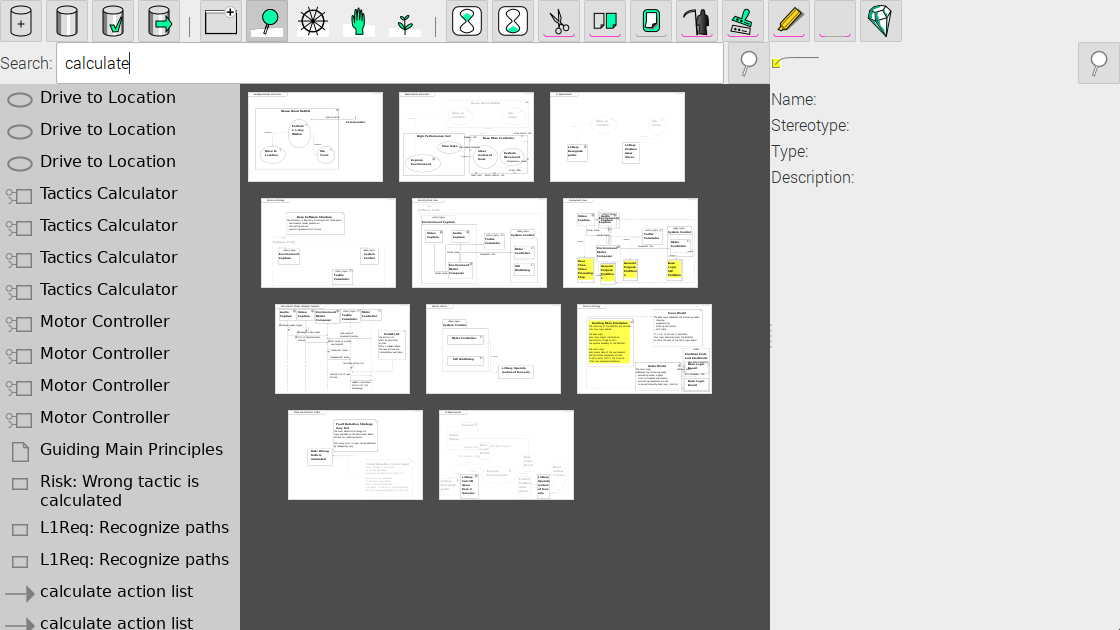
Enter the ID of an element (e.g. C0001) or a part of its name or description to find diagrams containing this element.
Enter nothing to find diagrams containing elements without description.
 Starts a search and displays the results
In case the list of search results is too long, consider to export the model and search in the generated output instead.
![]()
To navigate to parent, sibling or children diagrams, click on the diagram.
To create a new diagram, click on the
 icon, or the smaller
 icon for a new child-diagram.
 To restructure the diagram tree, drag a diagram name to the new location.
![]()
Click on the diagram or a classifier or a feature or a relationship to edit the name, type and description of that object.
The yellow corners indicate which object is currently focused.
Click on an element to select or unselect an object (pink corners).
The toolbar buttons apply to this pink-cornered set.
 To move classifiers within the diagram, 1.) press, 2.) drag and 3.) release the mouse button.
Note: When moving a classifier, this is moved in all diagrams where it appears. Order and locations of things stay consistent between different views.
It is not possible to change source and destination classifiers of relationships. Instead, delete the old and create a new relationship.
![]()
 To create a classifier, click at an empty space in the diagram.
To create a child classifier, click into the white space of the parent classifier. (Alternatively, create a classifier and a containment relationship.)
 To create a feature, click onto a classifier border (not on the classifier name).
 To create a relationship, press on the source classifier or feature
and drag it to the destination classifier or feature.
To create a relationship, press on the source classifier or feature
and drag it to the destination classifier or feature.
To modify existing elements, switch back to edit mode: the section called “Edit”.
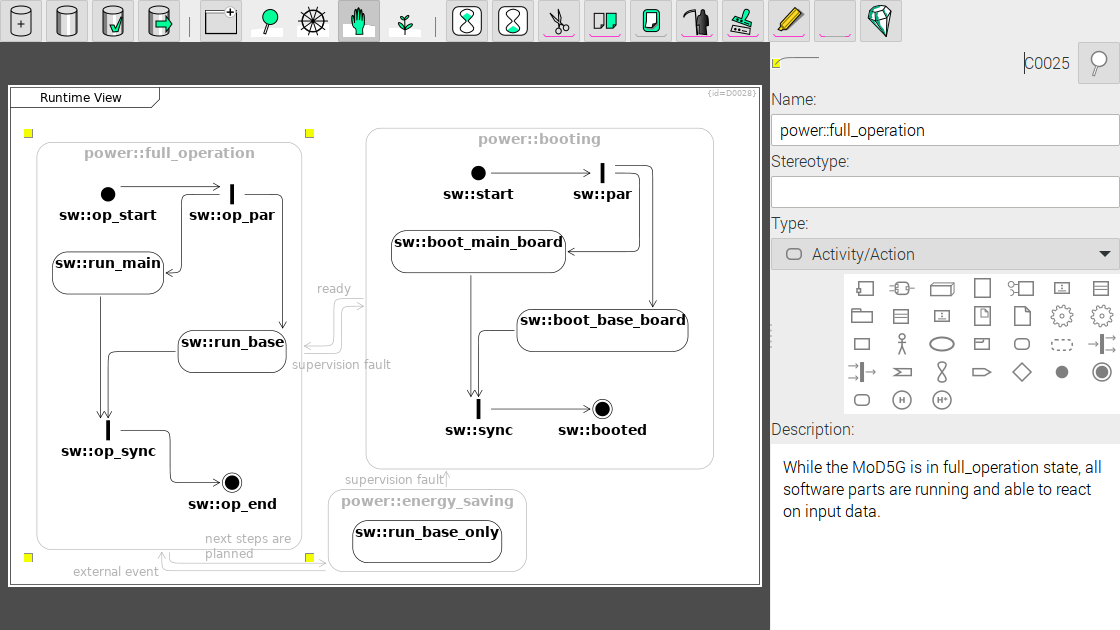
The right side of a window shows the properties of the focused model element.
 |
Edit the properties of the focused (yellow-cornered) object.
name of the focused object
stereotype of the focused object.
Stereotype names shall consist of characters that are valid XML tokens (Nmtoken).
Multiple stereotypes shall be separated by comma.
Rendering images of stereotypes only works for single stereotypes.
In case of properties and operations enter the type of the property or operation arguments, in case of tagged values, enter the value (instead of a stereotype).
type of the focused object
description of the focused object.
For html and DocBook export, use a double linebreak to create a new paragraph, start lines with *, + or - to format a list, use D0001#id and D0001#name to create a link to the diagram D0001 (showing either the id or the name).
The bottom row of a window, if shown, displays the result of the last user interaction.
 |
The notification bar appears automatically when there is a new message.
Such a message may show statistics on performed actions like created, exported, modified, deleted for the following elements
diagrams,
classifiers refer to the model-nodes,
classifier-occurrences refer to the visualization of a classifier in a diagram,
features denote properties, operations and ports of classifiers,
relationships are the edges between the classifiers or features or lifelines,
lifelines refer to implicit and automatically managed objects needed to visualize temporal behavior.